
Ahead of the busy Summer 2023 season, we ask the following question: How are New York’s main three airports performing?
Using data from RadarBox.com, we will take a look at New York’s JFK, Newark & LaGuardia airports to see how things are going.
Without further ado, let’s get into the numbers!
New York’s JFK…
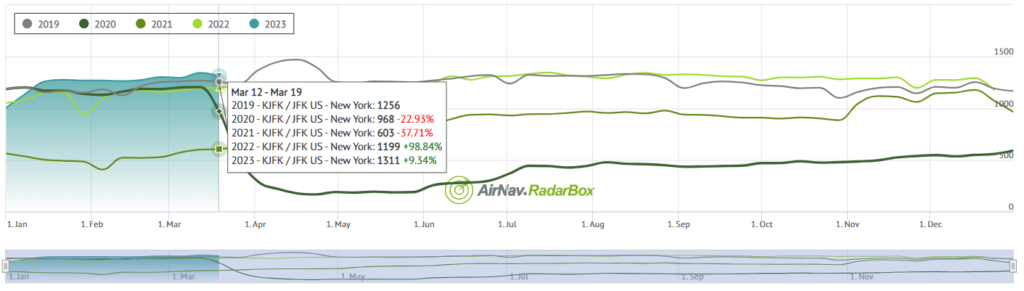
For March 12-19, New York’s JFK handled 1,311 movements based on a seven-day rolling average provided by the flight tracking company.
This represents an increase of 9.34% compared to the same period last year and is 55 more movements than the same period in 2019 (Pre-COVID).
Below is the last four weeks’ worth of data for the largest airport in New York:
| Date | 2019 Numbers | 2022 Numbers | 2023 Numbers | Percentage Difference (2023 vs. 2022) |
| February 12-19 | 1216 movements | 1169 movements | 1273 movements | +8.90% |
| February 19-26 | 1251 movements | 1157 movements | 1301 movements | +12.45% |
| February 26-March 5 | 1259 movements | 1172 movements | 1293 movements | +10.32% |
| March 5-12 | 1266 movements | 1190 movements | 1341 movements | +12.69% |
What we can see from the data is that JFK is exceeding pre-pandemic capacity and is definitely well set up for the Summer 2023 season.
[monsterinsights_popular_posts_inline]
Newark Liberty International Airport…
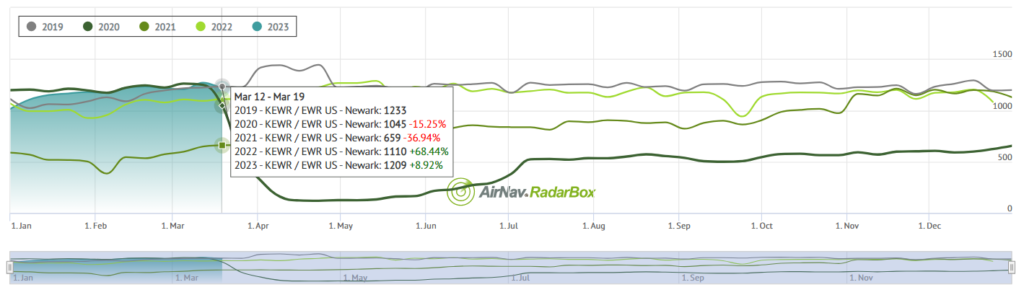
For March 12-19, New York’s Newark operated 1,209 movements based on the seven-day rolling averages.
This represents an increase of 8.92% compared to the same period last year and is 24 movements less than pre-COVID levels of 1,233 movements.
Below is the last four weeks’ worth of data for the airport:
| Date | 2019 Numbers | 2022 Numbers | 2023 Numbers | Percentage Difference (2023 vs. 2022) |
| February 12-19 | 1161 movements | 1102 movements | 1232 movements | +11.80% |
| February 19-26 | 1193 movements | 1076 movements | 1217 movements | +13.10% |
| February 26-March 5 | 1215 movements | 1105 movements | 1205 movements | +9.05% |
| March 5-12 | 1222 movements | 1092 movements | 1270 movements | +16.30% |
What we can see from the data is that New York’s Newark is dabbling in and out of post-COVID recovery, with the Summer 2023 season expected to see more consistent results.
LaGuardia…
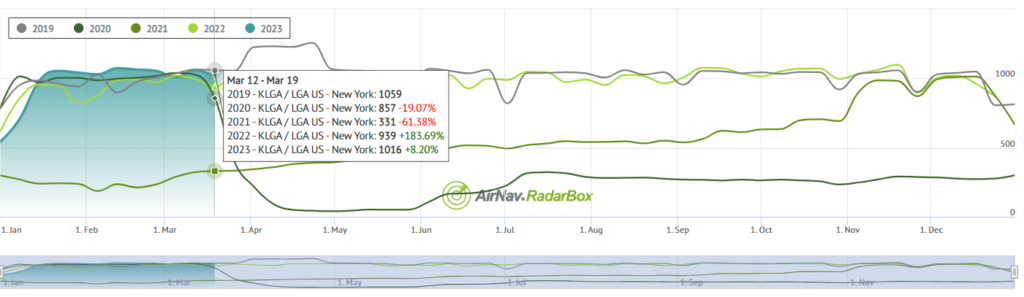
For March 12-19, New York’s LaGuardia operated 1,016 movements based on a seven-day rolling average provided by the flight tracking company.
This represents an increase of 8.20% compared to the same period last year, with this figure being 43 movements short of pre-COVID levels.
Below is the last four week’s worth of data regarding the airport:
| Date | 2019 Numbers | 2022 Numbers | 2023 Numbers | Percentage Difference (2023 vs. 2022) |
| February 12-19 | 975 movements | 993 movements | 1064 movements | +7.15% |
| February 19-26 | 1009 movements | 973 movements | 1055 movements | +8.43% |
| February 26-March 5 | 1036 movements | 1020 movements | 1010 movements | -0.98% |
| March 5-12 | 1065 movements | 995 movements | 1059 movements | +6.43% |
Like Newark, LaGuardia is bouncing in and out of post-COVID recovery, with it expected to be more reinforced when it’s busier in the Summer 2023 season.
Overall…

It remains clear that for New York’s airports, JFK remains strong and has definitely recovered from the effects of COVID-19 on the movement statistics front.
Newark and LaGuardia are very close to busting through the pre-pandemic figure, with it expected to remain consistent by Summer 2023.
But for now, all eyes are on all three airports to see how they perform over that busy period of the year.
