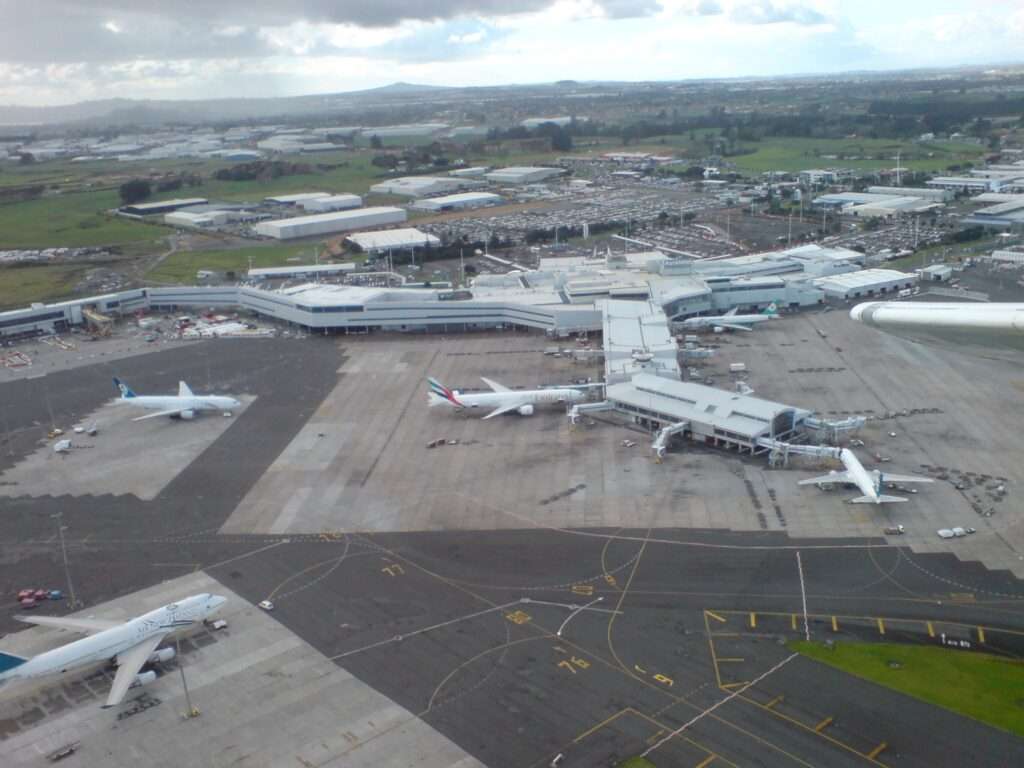
Auckland Airport in New Zealand is making strong gains in getting close to pre-pandemic flight movement numbers.
Using data from RadarBox.com, we will see how the airport is performing, and just exactly how much closer they are to achieving similar numbers to 2019.
Without further ado, let’s get into it…
Auckland Airport’s Movement Numbers…
[monsterinsights_popular_posts_inline]
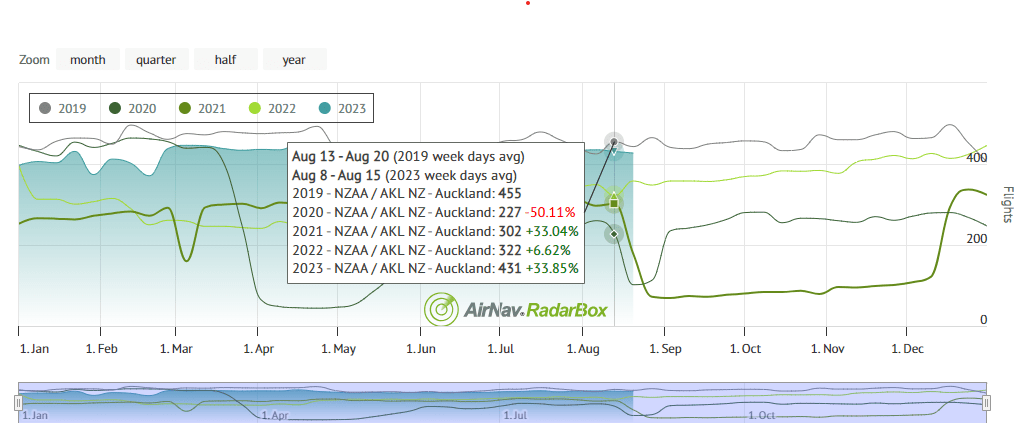
For August 8-15, Auckland Airport had an average of 431 daily flights, which is based on a seven-day overall report that is measured each week.
This represents a significant increase of 33.85% compared to the same period last year, and is around 24 movements shy of pre-pandemic figures.
Below is the last four weeks’ worth of data based on the airport:
| Date | 2019 Numbers | 2022 Numbers | 2023 Numbers | Percentage Difference (2023 vs. 2022) |
| July 11-18 | 479 movements | 344 movements | 437 movements | +27.03% |
| July 18-25 | 461 movements | 355 movements | 423 movements | +19.15% |
| July 25-August 1 | 441 movements | 344 movements | 432 movements | +25.58% |
| August 1-8 | 425 movements | 349 movements | 435 movements | +24.64% |
What we can see from the data is that Auckland Airport has been consistently producing double digit percentage increases in movement numbers.
This has enabled them to get very close, and even in one week, exceed pre-pandemic levels, meaning the path is on the up for them.
Looking ahead, all eyes will be on the airport to see whether they will be able to consistently exceed 2019’s numbers by the end of the year.
The ball is in their court. Let’s see what else comes out of it.

Click the banner to subscribe to our weekly newsleter.


