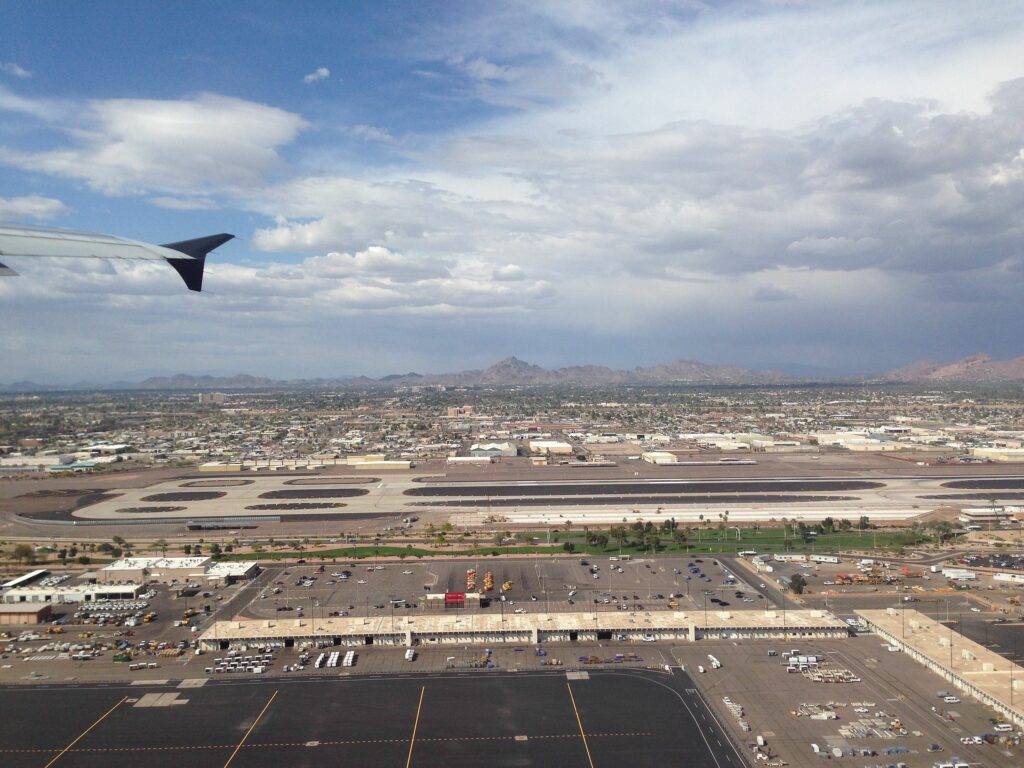
Phoenix Sky Harbor International Airport is the busiest airport in the state of Arizona. Without further ado, let’s take a look at the airport.
Using data from RadarBox.com, we will take a look at the airport’s most active airlines and busiest city pairs, as well as how their 2023 has performed so far.
Without further ado, let’s get into the numbers…
Most Active Airlines in Phoenix Sky Harbor…
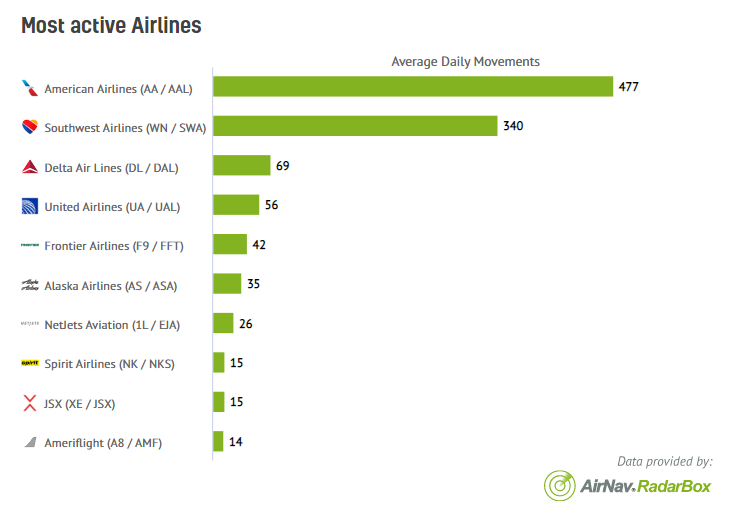
As we can see from the data above, the four most active airlines are American Airlines, Southwest Airlines, Delta Air Lines, and United Airlines.
American Airlines is the most active out of Phoenix Sky Harbor, with an average of 477 daily movements, with Southwest Airlines coming in second with 340 average daily movements from the Arizona-based airport.
There is then a considerable gap between Southwest Airlines and Delta Air Lines, who offer 69 average daily movements, with United Airlines coming in at 56 movements.
Such a statistic regarding American Airlines isn’t surprising, given the fact that the airport in Arizona is one of its many hubs around the U.S.
The Busiest City Pairs…
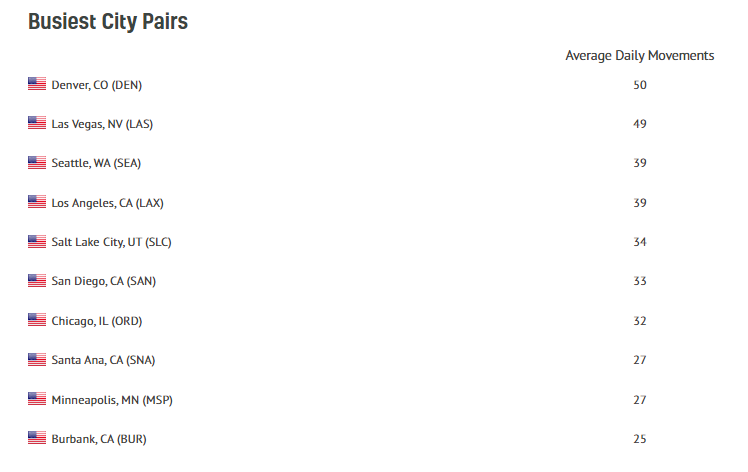
The busiest city pair for Arizona’s Phoenix Sky Harbor International Airport is to Denver, with an average of 50 daily movements.
Las Vegas, Nevada, comes in second, offering just a gap of one daily movement with Denver, at 49 movements.
Seattle and Los Angeles come in joint third with 39 daily movements, with Salt Lake City coming fourth with 34.
Arizona’s close proximity to Denver shows there shouldn’t be much of a surprise in it being the busiest city pair out of the airport.
Phoenix Sky Harbor Is Exceeding Expectations…

It remains clear that Phoenix Sky Harbor airport has been exceeding pre-pandemic expectations, as you will come to see in this section of the article.
For February 19-26, the airport handled 1,309 movements, based on a seven-day rolling average provided by RadarBox.com.
This represents an increase of 7.12% compared to the same period last year and is around 62 movements stronger than the same period in 2019.
Below is the data for Phoenix’s movement statistics for the whole of 2023 so far:
| Date | 2019 Numbers | 2022 Numbers | 2023 Numbers | Percentage Difference (2023 vs. 2022) |
| January 1-8 | 1125 movements | 1086 movements | 1192 movements | +9.76% |
| January 8-15 | 1111 movements | 1087 movements | 1206 movements | +10.95% |
| January 15-22 | 1126 movements | 1133 movements | 1254 movements | +10.68% |
| January 22-29 | 1126 movements | 1146 movements | 1296 movements | +13.09% |
| January 29-February 5 | 1177 movements | 1101 movements | 1262 movements | +14.62% |
| February 5-12 | 1140 movements | 1209 movements | 1392 movements | +15.14% |
| February 12-19 | 1186 movements | 1222 movements | 1396 movements | +14.24% |
What we can see from the data is that Phoenix Sky Harbor has started off 2023 on a very strong footing, with double-digit growth compared to the same periods last year and in 2019 as well.
The Final Verdict…
It remains clear that Phoenix Sky Harbor International Airport in Arizona has had a strong start to 2023, especially during a period that is typically quiet.
What will be interesting to see is how the airport will perform over the course of the Summer, when demand for air travel typically increases majorly.
But for now, all eyes are now on the Arizona-based airport to see where they can take things next.

